16.13. Points and LinesDrawing points is accomplished with the function imagesetpixel( ), which takes four parameters: the image to draw on, the X and Y coordinates, and the color to use. Thus, you can use it like this:
    $width = 255;
    $height = 255;
    $image = imagecreatetruecolor($width, $height);

    for ($i = 0; $i <= $width; ++$i) {
            for ($j = 0; $j <= $height; ++$j) {
                    $col = imagecolorallocate($image, 255, $i, $j);
                    imagesetpixel($image, $i, $j, $col);
            }
    }

    header("Content-type: image/png");
    imagepng($image);
    imagedestroy($image);
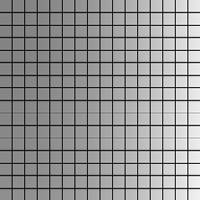
In that example, there are two loops to handle setting the green and blue parameters with imagecolorallocate( ), with red always being set to 255. This color is then used to set the relevant pixel to the newly allocated color, which should give you a smooth gradient like the one in Figure 16-23. Figure 16-23. Smooth gradiants using per-pixel coloring
Drawing lines is only a little more difficult than individual pixels, and is handled by the imageline( ) function. This time, the parameters are the image to draw on, the X and Y coordinates of the start of the line, the X and Y coordinates of the end of the line, and the color to use for drawing. We can extend our pixel script to draw a grid over the gradient by looping from 0 to $width and $height, incrementing by 15 each time, and drawing a line at the appropriate place. $width and $height were both set to 241 in the previous script because that is 255 - 15 + 1, which means it is the largest grid we can draw using the stock 0-255 color range. The +1 is necessary because drawing a line on the 255th row of the picture would be invisibleit would be outside! Add these lines before the header( ) call:
    for ($i = 0; $i <= $width; $i += 15) {
            imageline($image, $i, 0, $i, 255, $black);
    }

    for ($i = 0; $i <= $height; $i += 15) {
            imageline($image, 0, $i, 255, $i, $black);
    }
The first loop draws the vertical lines, so the X coordinate increments by 15 with each loop, whereas the Y coordinates are always 0 and 255, or from the very top to the very bottom. The second loop does the same for the horizontal lines, so this time it is the Y coordinates that change. To get the script to work, you will also need to add this line after the call to imagecreatetruecolor( ):
$black = imagecolorallocate($image, 0, 0, 0);
The output from that script should generate the picture shown in Figure 16-24. Figure 16-24. Grid lines created with imageline( ) and loops
The imagesetthickness( ) function allows you to specify the width in pixels of all lines drawn. All lines drawn using imageline( ) are affected, but it also affects rectangles, arcs, etc. To use the function, pass in the image to alter as parameter one, and the width in pixels as parameter two, then simply draw lines. The new thickness remains in place until you change it again or destroy the image. |