A Tracing ExampleTo see exactly what APD generates, you can run it on the following simple script: <?php
apd_set_pprof_trace();
hello("George");
goodbye("George");
function hello($name)
{
print "Hello $name\n";
sleep(1);
}
function goodbye($name)
{
print "Goodbye $name\n";
}
?>
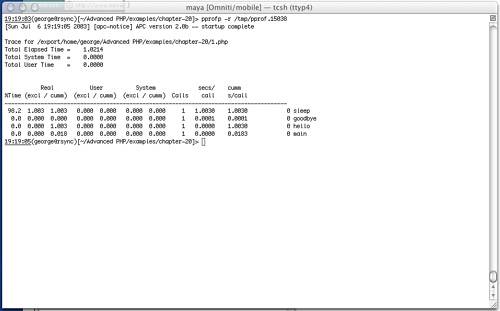
Figure 18.1 shows the results of running this profiling with -r. The results are not surprising of course: sleep(1); takes roughly 1 second to complete. (Actually slightly longer than 1 second, this inaccuracy is typical of the sleep function in many languages; you should use usleep() if you need finer-grain accuracy.) hello() and goodbye() are both quite fast. All the functions were executed a single time, and the total script execution time was 1.0214 seconds. Figure 18.1. Profiling results for a simple script.
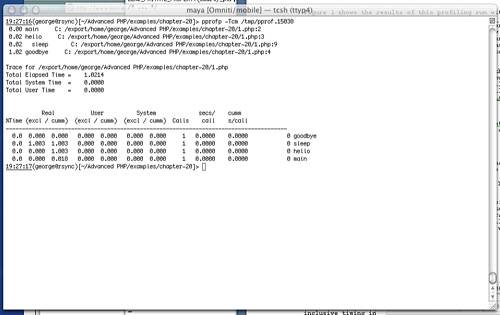
To generate a full call tree, you can run pprofp with the -Tcm options. This generates a full call tree, with cumulative times and file/line locations for each function call. Figure 18.2 shows the output from running this script. Note that in the call tree, sleep is indented because it is a child call of hello(). Figure 18.2. A full call tree for a simple script.
|